

Debugging an evaluation? Go to Diagnose a trial.
Investigating activity from your real tools? Connect a tool.
What you’re looking at
- Event: something that happened in a connected tool or your app, such as a customer reporting duplicate invoice lines.
- Trace and spans: related steps and their timing, such as looking up an order, opening a case, and calling a tool.
- Request: one API call to a twin, with its response.
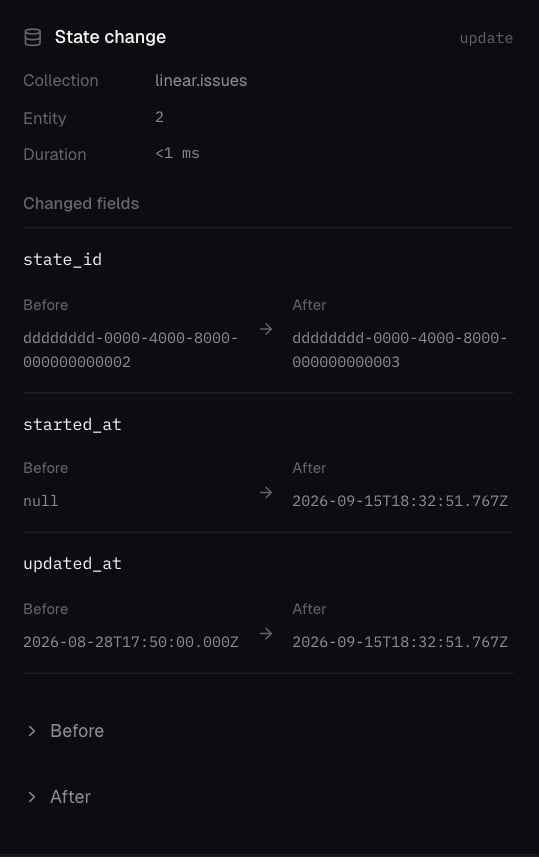
- Mutation: the record change, including before and after—for example, ENG-2 moving from Todo to In Progress.
- Score: a scorer’s verdict on one trial, such as issue check passed and handoff check failed.
Get real activity in
Connect a tool
Connections → Add connection, pick a source, and authorize it. Activity appears in Timeline as it happens. If the connection is healthy but an event you expect is missing, check you connected the right account and that the activity actually occurred.Instrument your app or agent
Give spans clear names (
lookup_invoice, update_linear_issue,
notify_finance) and include the IDs your team searches by (order, case). See
the Events API.
Connecting your real Salesforce doesn’t populate a test world. Use real
activity to find the cases worth testing; use a world to make them repeatable.
Investigate real events
Open Timeline.- Search or filter to the incident.
- Group by Topic to scan categories, or by Trace to follow one thread.
- Select an event for details. Live follows now; turn it off and choose Fit to inspect a fixed window.
- Found a useful case? Choose Add trace to turn it into a task. See Tasks and scorers.
Inspect a world
Open the world in Worldsmith → Timeline. Group by Source for one service or Trace for related calls. Select a request to see its response and the records it changed; select a mutation to see before and after. Load older activity pages back. Try it below: expand Linear, select the update request, then open its state change to compare before and after. This recorded local request moved ENG-2 from Todo to In Progress; it was not an agent evaluation.View the request and state-change screenshots
View the request and state-change screenshots
- Request
- Record change
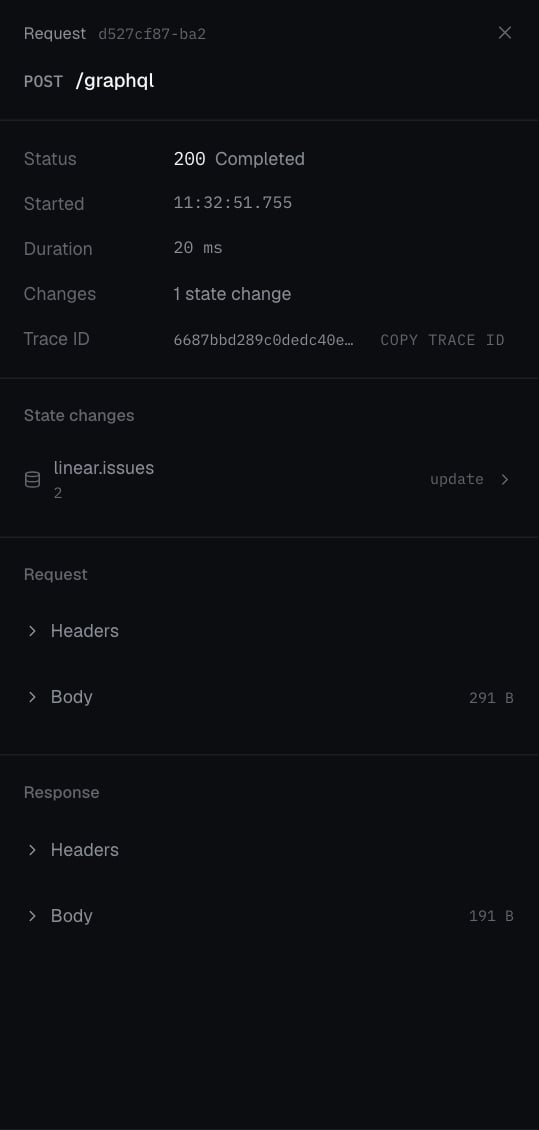
A real local API request: POST /graphql completed with HTTP 200 and recorded one state change.
Diagnose a trial
1
Find the case
In the run, open Cases and find the task that failed or regressed.
Look at each scorer, not just the total.
2
Open the trial
Switch to Raw trials and select the attempt. Read Instruction,
Scores, and Failure if present.
3
Walk the Timeline
Follow setup, agent steps, tool calls, and scoring in order. For the
duplicate-invoice task: did the agent find ENG-2, did it send the update, did it post to
#erp-alerts?4
Match the score to the evidence
World-state scorers check recorded changes. If the agent says it posted,
look for the Slack request, its response, and the created message. If
evidence is missing, check the selected trial, routing, and capture before
concluding that no action was taken.